
UK MLB Attendance Metrics and Outright Odds Pricing
 Available in US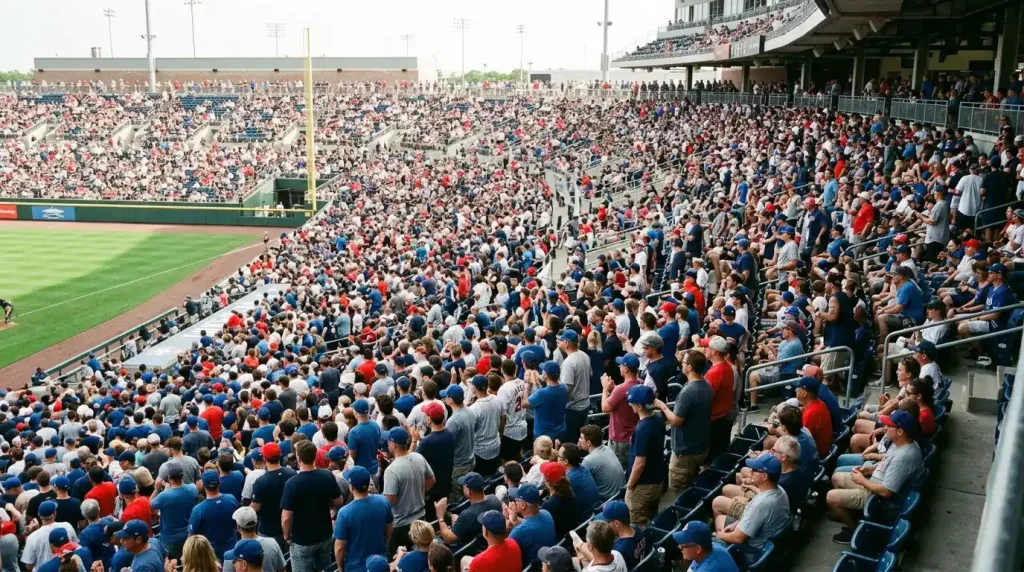
The Sport Is Growing Again, and Outright Books Notice
Three consecutive seasons of MLB attendance growth – the first such run since 2005 to 2007 – have shifted the economics of MLB outright betting in ways that don’t show up on any single coupon but do show up across the structural pricing of the markets. 2025 saw 71,409,421 fans through the gates across the 4,860 regular-season games, an average of 29,459 per game. The Dodgers became the first franchise since 2008 – and the first ever for the team – to top four million in single-season attendance, finishing at 4,012,470. The pace of play story added to the picture: 2025’s average game time of 2:38 was the third consecutive year under 2:40, the first such streak in 40 years stretching back to 1983-1985.
Why does any of this matter for UK outright punters? Because volume drives pricing structure. More fans, more viewers, more handle, more betting interest at every operator, more competition for the same outright markets. The growth has been steady enough through 2023, 2024 and 2025 that it’s reshaped how UK and US sportsbooks approach pre-season MLB pricing in 2026 – and, broadly, made the markets sharper, deeper and more responsive than they were two years ago.
The 71-Million Number Decoded
71.4 million fans is a meaningful number on its own, but the structural details around it tell a more useful story for punters. The growth was concentrated in specific markets. The Dodgers led with their record-setting four million figure, but other major-market teams also showed strong year-on-year improvement. Teams in mid-sized markets – Cincinnati, San Diego, Seattle – saw modest growth that suggests the rebound is broader than just the major franchises driving the headline numbers.
What that means for outright pricing is that betting handle on MLB grew alongside attendance across most operator markets. The biggest pricing implication isn’t that more money is being bet on the Dodgers – it’s that more money is being bet across the spectrum of teams, which gives books more confidence in pricing the longer-shot selections. A team with thin betting interest historically priced higher overround into the implied probabilities; better volume across a broader set of teams compresses overround on selections that previously sat in the long tail.
The practical effect for outright punters is most visible in division-winner markets and in pennant markets on second-tier contenders. Teams priced at decimal 12.00 to 25.00 in pre-season pennant markets saw their effective overround compress by roughly 1-2 percentage points across operator boards from 2023 to 2025, simply because handle volume on these selections grew enough to support tighter pricing. UK retail punters benefit from this without ever knowing the underlying mechanics.
Why the 2:38 Average Game Matters to Books
Pace of play matters for pricing for several non-obvious reasons. The first is in-play and live-betting volume. A 2:38 average game compresses the natural betting window – there’s less time for in-play position adjustment, fewer opportunities for late-game props, less middle-inning content for casual viewers to engage with. That doesn’t directly affect outright pricing, but it shifts where operators allocate their pricing-team attention. With fewer in-play and prop opportunities per game, more attention flows to outright pricing – which makes outright lines sharper.
The second effect is on broadcasting and viewership. Faster games hold viewer attention better, and viewership growth correlates with handle growth across most operator markets. The 2:38 figure isn’t just a stat; it’s the foundation of why MLB regular-season audiences have grown for three consecutive years and why operator interest in pre-season outright pricing has grown alongside.
The third effect is more subtle: pace of play affects roster construction in ways that feed into outright pricing. Faster games favour deeper bullpens, because relief pitchers see more leverage situations earlier in games. Faster games marginally favour contact hitters over high-strikeout sluggers, because at-bat efficiency matters more in compressed windows. These effects are small but real, and outright punters who understand them have edges in pricing teams whose roster construction reflects the new equilibrium versus teams still optimising for the slower-paced game of 2018.
The pace-of-play change wasn’t accidental. The pitch clock and rule changes implemented in 2023 deliberately accelerated the game, and the trend has continued through 2024 and 2025 as players and umpires have refined the implementation. The structural sustainability of the 2:38 figure is reasonably high, which means the pricing implications are likely to persist rather than reverse.
The 17.8 Billion Social Number
Beyond traditional viewership, MLB’s social-media reach has grown sharply. 2025 social viewership reached 17.8 billion impressions across major platforms, a 20% year-on-year increase. The number is large enough to be a fundamental data point about how the sport is changing.
For outright pricing, social viewership matters because it’s a leading indicator of where retail betting volume will flow next. A 30/30 club season – with seven players hitting the milestone in 2025, a record number that included Carroll, Chisholm Jr., Lindor, Ramírez, Soto, Crow-Armstrong and Rodríguez – generates enormous social engagement around individual players, which translates over the next 12-18 months into individual-award futures volume on those same players. Books that price MVP, Rookie of the Year and Cy Young futures pay attention to social engagement as a predictor of where retail betting interest will concentrate.
The four players with 50+ home runs in 2025 – Raleigh, Schwarber, Ohtani, and Judge – generated similar social-engagement spikes that translated into individual home-run-leader futures volume in 2026. Punters who track which players are getting outsized social attention have a soft signal for where the books will concentrate pricing focus, which sometimes creates value on overlooked competitive selections.
The 30/30 and 50-homer milestones also affect team-level outright pricing more than retail bettors usually realise. Teams with multiple star players generating outsized individual offensive production correlate with strong team-level run production, which feeds into win projections, which feeds into pennant pricing. The headline-grabbing individual seasons usually contribute to the parent team’s outright pricing in subtle ways.
How Volume Feeds Back Into Margins
The structural feedback loop between attendance, viewership, betting handle and outright margin pricing is the part that takes time to articulate but matters most for serious punters.
The basic chain runs: attendance growth signals demand growth — viewership growth confirms broader audience interest — betting handle grows alongside — operators see better unit economics on their MLB businesses — operators price outrights more aggressively to compete for share — effective overround compresses across the board — punters get better effective prices on the same outcomes.
The chain has a 12-24 month lag because operator pricing teams take time to recalibrate based on volume data, and pricing committees prefer slow, evidence-based adjustments to fast reactive ones. The 2025 attendance and viewership numbers are still being absorbed into 2026 pricing, and the 2026 numbers will shape 2027 pricing in ways punters won’t directly notice.
The flip side is that the chain can run in reverse. If attendance plateaus or declines, if viewership softens, if handle softens – then operator margin discipline tightens, overround widens, and effective prices for punters get worse. The chain ran exactly this way through the COVID era and the slower recovery from 2021 to 2022, when MLB outright pricing was meaningfully wider than it is now in 2026.
For UK punters specifically, the additional layer is that the UK sports-betting market itself is growing – UK gross gambling yield reached £16.8 billion in the year to March 2025, with online sectors growing strongly. The UK and US growth stories are independent but reinforcing: more UK punters interested in MLB, more MLB betting handle on UK operators, tighter pricing on UK MLB markets specifically. Pre-season pennant pricing on UK retail in 2026 is meaningfully sharper than it was in 2022, and the trend should continue through 2027 unless one of the underlying growth stories reverses.
What All This Means When You’re Picking a Ticket
The practical implications for outright punters in 2026 come down to a few specific behaviours.
First, recognise that the pricing environment is sharper than it was 2-3 years ago. Effective overround on UK MLB outright markets is meaningfully tighter, and the easy money from broad mispricing is mostly priced out. Edges still exist – in spring training pricing windows, in cascade effects of injury news, in lag between US and UK pricing on specific events – but they’re narrower.
Second, the pre-season pricing on second-tier contenders is the single area where the volume-growth story has helped punters most. Teams priced at 10/1 to 25/1 to win the pennant in 2026 are getting tighter pricing than equivalent teams got in 2024, but tighter pricing is structurally fairer pricing – there’s less margin baked in, so the implied probabilities reflect more of the true probability of the outcome.
Third, pay attention to the social-engagement signals around individual players. Star players generating outsized social attention through 30/30 or 50-homer chases will influence both individual-award pricing and team-level outright pricing in ways that take retail bettors longer to absorb than the books themselves.
Fourth, the integrity-infrastructure investments that came alongside the demand growth are quietly making outright markets cleaner. The combination of more handle and tighter integrity monitoring means outright pricing in 2026 is the most fundamentally sound it’s been in MLB betting history. Punters who learned the discipline of fundamentals-based outright analysis can apply it more profitably now than at any prior point. My pre-season look at AL pennant odds for 2026 works through the specific selections where I see the pricing reflecting the structural dynamics covered above.
Frequently Asked Questions
How did MLB attendance and viewership grow in 2025?
2025 saw 71.4 million fans across 4,860 regular-season games, an average of 29,459 per game and the third consecutive year of growth - the first such run since 2005-2007. The Dodgers led at 4,012,470, the franchise's first time topping four million. Social viewership reached 17.8 billion impressions, a 20% year-on-year increase.
Why does pace of play affect outright pricing?
The 2:38 average game time of 2025, the third consecutive year under 2:40, has shifted operator pricing focus toward outright markets and away from in-play and prop markets. Faster games also favour bullpen depth and contact hitting, which affects the value of teams whose roster construction matches the new equilibrium versus those still optimising for the slower-paced game of 2018.
Are 2026 MLB outright prices structurally sharper than two years ago?
Yes. Three consecutive years of attendance and viewership growth have driven betting handle growth, which has tightened operator margin pricing on outright markets. UK retail pre-season pennant pricing in 2026 reflects effective overround that is meaningfully tighter than 2022-2024. Edges still exist for disciplined punters but are narrower than they were.
UK Articles on MLB Futures: Outright Betting Markets
UK Gambling Tax Rules
The One UK Rule American Sites Never Mention Every American MLB futures guide I have ever read has the same…
UK Football vs Baseball Betting
Football Owns the Coupon. MLB Owns the Quiet Margins. If you tell a UK punter you bet baseball, the response…
UK MLB Postseason Format
The Format That Quietly Changed Outright Prices Forever Most UK punters who've started betting MLB outrights since 2022 don't realise…
UK MLB Closing Line Value
Why CLV Matters on a Six-Month Bet The first season I tracked closing line value seriously, I went 1-for-12 on…
